- Foxtable(狐表) (http://foxtable.com/bbs/index.asp)
-- 专家坐堂 (http://foxtable.com/bbs/list.asp?boardid=2)
---- [求助]查询表的筛选 (http://foxtable.com/bbs/dispbbs.asp?boardid=2&id=74244)
-- 发布时间:2015/9/7 9:55:00
-- [求助]查询表的筛选
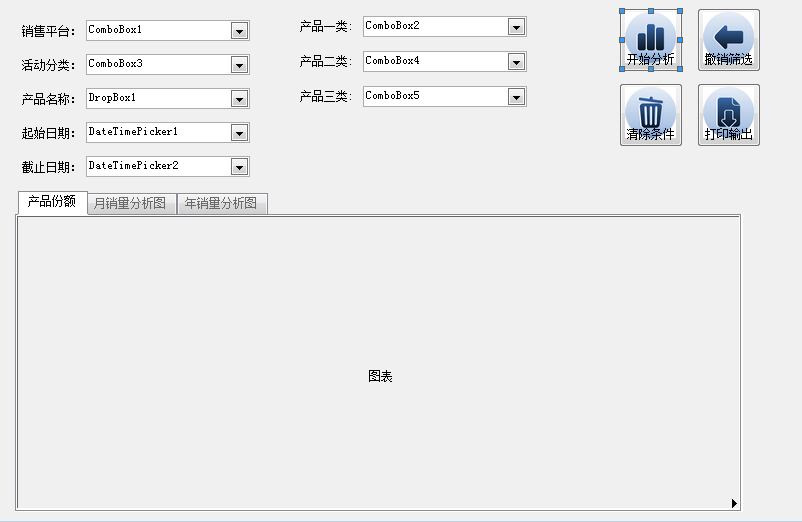
想通过图中筛选的条件来筛选查询表然后生成图表,可是图表生成的时候有些条件可以满足,有些条件却不能满足,是代码有问题吗,麻烦大神帮忙看看~~
Dim Filter As String
With e.Form.Controls("ComboBox1")
If .Value IsNot Nothing Then
Filter = "销售平台= \'" & .Value & "\'"
End If
End With
With e.Form.Controls("ComboBox3")
If .Value IsNot Nothing Then
If Filter > "" Then
Filter = Filter & " And "
End If
Filter = Filter & "活动分类= \'" & .Value & "\'"
End If
End With
With e.Form.Controls("ComboBox2")
If .Value IsNot Nothing Then
Filter = "产品一类 = \'" & .Value & "\'"
End If
End With
With e.Form.Controls("ComboBox4")
If .Value IsNot Nothing Then
If Filter > "" Then
Filter = Filter & " And "
End If
Filter = Filter & "产品二类 = \'" & .Value & "\'"
End If
End With
With e.Form.Controls("ComboBox5")
If .Value IsNot Nothing Then
If Filter >"" Then
Filter = Filter & " And "
End If
Filter = Filter & "产品三类 = \'" & .Value & "\'"
End If
End With
With e.Form.Controls("DropBox1")
If .Value IsNot Nothing Then
If Filter >"" Then
Filter = Filter & " And "
End If
Filter = Filter & "产品名称= \'" & .Value & "\'"
End If
End With
With e.Form.Controls("DateTimePicker1")
If .Value IsNot Nothing Then
If Filter >"" Then
Filter = Filter & " And "
End If
Filter = Filter & "销售日期 >= #" & .Value & "#"
End If
End With
With e.Form.Controls("DateTimePicker2")
If .Value IsNot Nothing Then
If Filter >"" Then
Filter = Filter & " And "
End If
Filter = Filter & "销售日期 <= #" & .Value & "#"
End If
End With
If Filter > "" Then
Tables("销售分析表").Filter = Filter
End If
Dim Chart As WinForm.Chart \'定义一个图表变量
Dim Series As WinForm.ChartSeries \'定义一个图系变量
Dim t As Table = Tables("销售分析表") \'定义一个变量t引用数据表
Dim sm As Integer = t.Compute("Sum(数量)") \'计算总数量
Chart= Forms("线上销售情况分析").Controls("Chart1") \' 引用窗口中的图表
Chart.VisualEffect = True \'加上这一行,让你的图表更漂亮
Chart.ChartType = ChartTypeEnum.Pie \'图表1类型改为Bar(条形)
For Each r As Row In t.Rows
Series = Chart.SeriesList.Add() \'增加一个图系
Series.Length = 1 \'一个系列只能包括一个值
Series.Text = r("产品名称") & "(" & r("数量") & ")" \'设置图系的标题
Series.Y(0) = r("数量") \'指定值
Series.DataLabelText = Math.Round(r("数量")*100/sm,2) & "%" \'计算百分比
Next
Chart.LegendVisible = True \'显示图列
Chart.LegendCompass= CompassEnum.East \'图列显示在东方(右方)
-- 发布时间:2015/9/7 9:59:00
--
什么意思,报什么错
-- 发布时间:2015/9/7 10:09:00
--
检查你的Filter,放到sql查询窗口看数据是否正确。
-- 发布时间:2015/9/7 11:10:00
--
呃。前面那个问题弄好了,新的问题来了~~
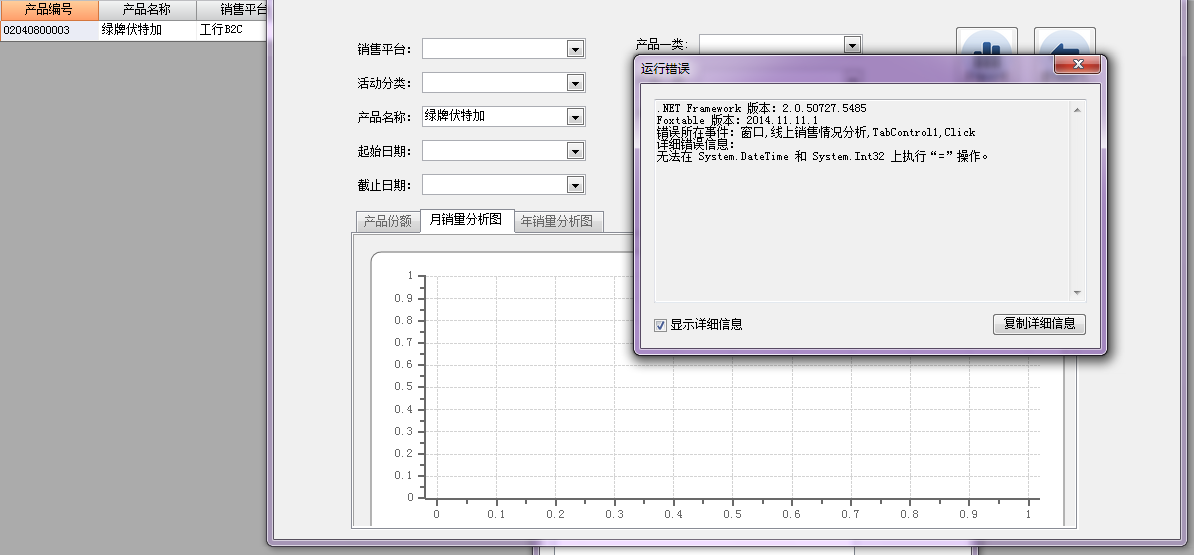
想在选择产品名称后通过查询表筛选出该产品的销量,并制出月销量图,但是出现以上错误,是什么问题啊??
Dim g As New GroupTableBuilder("统计表1", DataTables("销售分析表"))
g.Groups.AddDef("销售日期", DateGroupEnum.day)
g.Totals.AddDef("数量", AggregateEnum.sum)
Dim d As Date = new Date(Date.Today.Year, Date.Today.Month, 1)
g.Filter = "销售日期 >= #" & d & "# and 销售日期 < #" & d.AddMonths(1) & "#"
g.Build()
MainTable = Tables("销售分析表")
Dim Chart As WinForm.Chart \'定义一个图表变量
Dim Series As WinForm.ChartSeries \'定义一个图系变量
Dim t As Table = Tables("销售分析表") \'定义一个变量t引用数据表
Chart= Forms("线上销售情况分析").Controls("Chart2") \' 引用窗口中的图表
Chart.SeriesList.Clear() \'清除图表原来的图系
chart.AxisX.ClearValueLabel
Chart.ChartType = ChartTypeEnum.Bar \'图表类型该为Bar(条形)
Series = Chart.SeriesList.Add() \'增加一个图系
Series.Length = Date.DaysInMonth(d.Year, d.Month) + 1 \'设置图系的长度
For i As Integer = 1 To series.Length \'指定每个数据点的位置
Dim idx As Integer = t.FindRow("销售日期 = " & i)
If Idx >= 0 Then
Series.X(i) = i \'指定水平坐标
Series.Y(i) = t.Rows(idx)("数量") \'指定垂直坐标
Chart.AxisX.SetValueLabel(i, t.Rows(idx)("销售日期")) \'指定字符表示
Else
Series.X(i) = i \'指定水平坐标
Series.Y(i) = 0
Chart.AxisX.SetValueLabel(i, i) \'指定字符表示
End If
Next
Chart.AxisX.AnnoWithLabels = True \'启用字符标示
-- 发布时间:2015/9/7 11:11:00
--
谢谢指导,自己摸好了~
-- 发布时间:2015/9/7 14:14:00
--
大红袍大神,求助四楼的问题
-- 发布时间:2015/9/7 15:24:00
--
Dim idx As Integer = t.FindRow("销售日期 = " & i)
改成
Dim idx As Integer = t.FindRow("销售日期 = #" & d.AddDays(i-1) & "#")
-----------------
再有问题,请上传具体例子
 此主题相关图片如下:无标题.png
