- Foxtable(狐表) (http://foxtable.com/bbs/index.asp)
-- 专家坐堂 (http://foxtable.com/bbs/list.asp?boardid=2)
---- chart的横坐标日期表示 (http://foxtable.com/bbs/dispbbs.asp?boardid=2&id=186239)
-- 发布时间:2023/4/15 11:33:00
-- chart的横坐标日期表示
有两个表,分别是
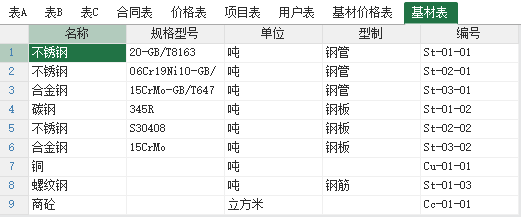
1、基材表,定义了名称、规格型号、单位、型制、编号
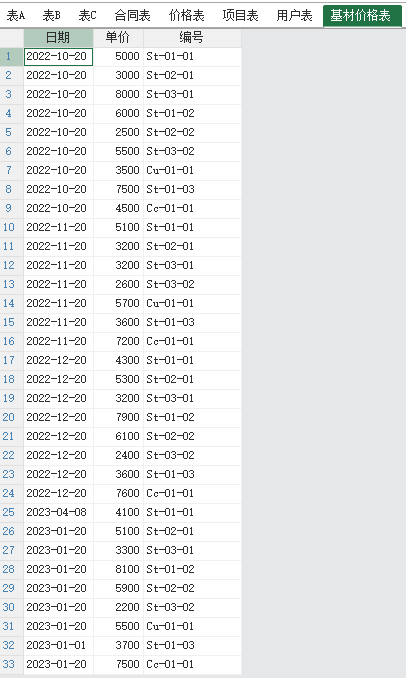
2、基材价格表,定义了日期、单价、编号
基材价格表是对基材表中的基材按日期给出价格(通过编号进行对应),现在想把基材价格表用chart表达出来,一种基材一个Series,横坐标为日期:每次选择不同的基材或者修改日期,都触发刷新,
横坐标希望是日期,但运行结果却是1、2、3、4、5
源程序见链接,提取码:1234
https://pan.baidu.com/s/1kGKj8J1-TO_FP5D7APkVQQ
窗口:基材管理
-- 发布时间:2023/4/15 11:35:00
--
 此主题相关图片如下:基材表.png
-- 发布时间:2023/4/15 11:36:00
--
 此主题相关图片如下:基材价格管理.png
 此主题相关图片如下:基材价格表.png
-- 发布时间:2023/4/15 12:15:00
--
刷新代码:
Dim cht As WinForm.Chart = e.Form.Controls("cht_BaseMaterialPrice")
\'chart控件
Dim lst As WinForm.CheckedListBox = e.Form.Controls("lst_BaseMaterial")
\'复选框列表
Dim dt1 As WinForm.DateTimePicker = e.Form.Controls("tm_Begin")
\'起始时间
Dim dt2 As WinForm.DateTimePicker = e.Form.Controls("tm_End")
\'结束时间
Dim drs As List (Of DataRow)
Output.Clear()
If e.Form.Controls("lbl_Init").Text = "0" Then
Return
End If
If dt1.Value >= dt2.Value Then
MessageBox.Show("起始日期晚于结束日期,请重新选择!")
Return
End If
Dim dr As DataRow
Dim Filter As String = ""
Dim strName As String
Dim name As String, num As String
Dim strList() As String
Dim last As Single = 0
Dim dateStrList As List(Of String)
dateStrList = DataTables("基材价格表").GetValues("日期", "[日期] >= #" & dt1.Value & "# AND [日期] <= #" & dt2.Value & "#")
Output.Show("基材价格管理 refresh0")
If lst.CheckedIndices.Count > 0 Then
Dim Series As WinForm.ChartSeries \'定义一个图系变量
cht.SeriesList.Clear() \'清除图表原来的图系
cht.ChartType = ChartTypeEnum.XYPlot \'图表类型改为线形
\' cht.AxisX.DateType = True \'X轴是日期型
\' cht.AxisX.AnnoFormatString = "yyyy.MM"
For Each index As Integer In lst.CheckedIndices
strList = lst.Items(index).ToString().Split("|")
name = strList(0)
num = strList(1)
Filter = Filter & "编号 = \'" & num & "\' or "
Output.Show("基材价格管理 refresh index=" & index & " item= " & lst.Items(index).ToString() & " name=" & name & " num=" & num & " " & dateStrList.Count)
Series = cht.SeriesList.Add() \'增加一个图系
Series.Text = name \'设置图系的标题
Series.Length = dateStrList.Count \'设置图系的长度
For i As Integer = 0 To dateStrList.Count - 1 \'指定每个数据点的位置
Output.Show("基材价格管理 refresh dateStrList " & i & " " & dateStrList(i) & " 编号 = \'" & num & "’and 日期 = \'" & dateStrList(i) & "\'")
Series.X(i) = i \'dateStrList(i) \'指定水平坐标
dr = DataTables("基材价格表").Find("编号 = \'" & num & "\' and 日期 = \'" & dateStrList(i) & "\'") \'找出编号为03的产品
If dr IsNot Nothing AndAlso dr.IsNull("单价") = False Then
Series.Y(i) = dr("单价") \'指定垂直坐标
last = dr("单价")
Output.Show("基材价格管理 refresh dateStrList " & i & " " & last)
Else
Series.Y(i) = last
Output.Show("基材价格管理 refresh dateStrList " & i & "last")
End If
cht.AxisX.SetValueLabel(i, dateStrList(i)) \'指定字符表示
Output.Show("基材价格管理 refresh dateStrList " & i & " " & dateStrList(i).Split(" ")(0) & " end")
Next
Next
cht.VisualEffect = True \'加上这一行,让你的图表更漂亮
cht.LegendVisible = True \'显示图列
cht.LegendCompass = CompassEnum.South \'图列显示在南方(底端)
Filter = Filter.Substring(0, filter.Length - 3)
Dim max As Double, min As Double
max = DataTables("基材价格表").Compute("Max(单价)", Filter)
min = DataTables("基材价格表").Compute("Min(单价)", Filter)
Output.Show("基材价格管理 refresh Filter= " & Filter & " max=" & max & " min=" & min)
cht.AxisY.Max = Math.Round(max * 1.2 / 1000, 0) * 1000 \'指定Y轴的最大值
cht.AxisY.Min = Math.Round(min * 0.8 / 1000, 0) * 1000 \'指定Y轴的最小值
cht.AxisY.Major = 500 \'主刻度间隔值为500
End If
-- 发布时间:2023/4/15 14:07:00
--
| 下载信息 [文件大小: 下载次数: ] | |
 点击浏览该文件:管理项目1.zip 点击浏览该文件:管理项目1.zip |