- Foxtable(狐表) (http://foxtable.com/bbs/index.asp)
-- 专家坐堂 (http://foxtable.com/bbs/list.asp?boardid=2)
---- 生成图表,数据排序怎么解决呢? (http://foxtable.com/bbs/dispbbs.asp?boardid=2&id=136308)
-- 发布时间:2019/6/11 10:30:00
-- 生成图表,数据排序怎么解决呢?
Dim Chart As New ChartBuilder
Dim Series As WinForm.ChartSeries \'定义一个图系变量
Chart.VisualEffect = True \'加上这一行,让你的图表更漂亮
Chart.ChartType = ChartTypeEnum.XYPlot \'图表1类型该为Bar(条形)
Chart.ChartType2 = ChartTypeEnum.XYPlot \'图表2类型该为线形
Chart.DataSource = "历年院校分数mydb" \'设置绑定表
chart.DataFilter="((([院校名称] Like \'%河北师范大学%\') And ([院校名称] = \'河北师范大学\')) And ([科类] = \'理工\')) And ([批次] = \'本科一批\')"
Chart.SeriesList.Clear() \'清除图表原来的图系
Series = Chart.SeriesList.Add() \'给图表1增加一个图系
Series.Text = "录取数"
Series.X.DataField = "年度" \'X轴绑定到产品列
Series.Y.DataField = "录取数" \'Y轴绑定到数量列
Chart.SeriesList2.Clear() \'清除图表原来的图系
Series = Chart.SeriesList2.Add() \'给图表2增加一个图系
Series.Text = "本批位次"
Series.X.DataField = "年度" \'X轴绑定到产品列
Series.Y.DataField = "本批位次" \'Y轴绑定到数量列
Chart.LegendVisible = True \'显示图列
Chart.LegendCompass= CompassEnum.South \'图列显示在南方(底端)
Chart.AxisY.Text = "数量"
Chart.AxisY2.Text = "金额"
Chart.PrintWidth = 140
Chart.PrintHeight = 100
Chart.SaveImage(ProjectPath & "Images\\myimg.wmf")
老师,
Chart.DataSource = "统计表"
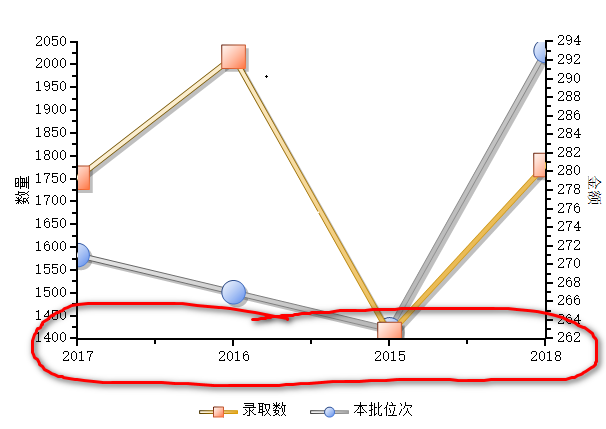
我可以指定的表是不是必须是datatable呢?如果我用条件加载,但是排序的问题没法解决呢?您看我下面的图,年份是混乱的,我想按年份排好后在生成图表,怎么办呢?
-- 发布时间:2019/6/11 11:46:00
--
必须换一种方式处理,如
http://www.foxtable.com/webhelp/scr/0968.htm
-- 发布时间:2019/6/11 14:32:00
--
老师,我也想过这种方式,但是我想在点上加上固定显示的数值,有办法吗?
我看只能是Series.DataLabelText = "{#YVAL}"
还有我显示图例Chart.LegendVisible=True,用这种方式显示的是0之类的数字,不是汉字
-- 发布时间:2019/6/11 23:11:00
--
只能是Series.DataLabelText = "{#YVAL}"
Series.Text = "某某名称"
 此主题相关图片如下:2019-06-11_102252.png