- Foxtable(狐表) (http://foxtable.com/bbs/index.asp)
-- 专家坐堂 (http://foxtable.com/bbs/list.asp?boardid=2)
---- 项目进度甘特图 (http://foxtable.com/bbs/dispbbs.asp?boardid=2&id=122420)
-- 发布时间:2018/7/25 10:49:00
-- 项目进度甘特图
 此主题相关图片如下:企业微信截图_20180725104226.png
项目进度甘特图
| 下载信息 [文件大小: 下载次数: ] | |
 点击浏览该文件:项目进度甘特图.table 点击浏览该文件:项目进度甘特图.table |
-- 发布时间:2018/7/25 11:04:00
--
| 下载信息 [文件大小: 下载次数: ] | |
 点击浏览该文件:项目进度甘特图.table 点击浏览该文件:项目进度甘特图.table |
-- 发布时间:2018/7/26 13:42:00
--
图形的条形可以固定衣一个颜色吧 比如蓝色
现在的颜色每次都循环 不固定
[此贴子已经被作者于2018/7/26 14:18:33编辑过]
-- 发布时间:2018/7/26 14:39:00
--
Dim cr = e.Table.current
If cr IsNot Nothing AndAlso Forms("窗口1").opened Then
Dim Chart As WinForm.Chart
Chart= Forms("窗口1").Controls("Chart1")
Chart.ChartType = ChartTypeEnum.Gantt
Chart.Inverted = True \'对调X轴和Y轴位置
Chart.AxisY.DateType= True \'Y轴为日期型
Chart.AxisY.AnnoFormatString = "MM-dd" \'设置Y轴的标示格式
Dim t1 As Table = Tables("项目")
Dim t2 As Table = Tables("项目进度")
Dim min = t2.Compute("min(开始时间)", "项目 = \'" & t1.current("项目") & "\'")
Dim max = t2.Compute("max(结束时间)", "项目 = \'" & t1.current("项目") & "\'")
Chart.AxisY.MinDate = min
Chart.AxisY.MaxDate = max \'设置Y轴的终止日期
Chart.AxisX.GridMajorVisible = False \'隐藏X轴的网格线
chart.AxisX.ClearValueLabel
Chart.SeriesList.Clear
Dim i As Integer = 0
With Chart.SeriesList
For Each dr As DataRow In t2.DataTable.Select("项目 = \'" & t1.current("项目") & "\'")
.AddGanttSeries(dr("进度节点"), dr("开始时间"), dr("结束时间"))
.AddGanttLabels("M月d日")
Chart.SeriesList(i).LineColor= Color.Red
i += 1
Next
End With
End If
-- 发布时间:2018/7/26 15:36:00
--
文字固定成黑色呢 老师
-- 发布时间:2018/7/26 16:04:00
--
Dim cr = e.Table.current
If cr IsNot Nothing AndAlso Forms("窗口1").opened Then
Dim Chart As WinForm.Chart
Chart= Forms("窗口1").Controls("Chart1")
Chart.ChartType = ChartTypeEnum.Gantt
Chart.Inverted = True \'对调X轴和Y轴位置
Chart.AxisY.DateType= True \'Y轴为日期型
Chart.AxisY.AnnoFormatString = "MM-dd" \'设置Y轴的标示格式
Dim t1 As Table = Tables("项目")
Dim t2 As Table = Tables("项目进度")
Dim min = t2.Compute("min(开始时间)", "项目 = \'" & t1.current("项目") & "\'")
Dim max = t2.Compute("max(结束时间)", "项目 = \'" & t1.current("项目") & "\'")
Chart.AxisY.MinDate = min
Chart.AxisY.MaxDate = max \'设置Y轴的终止日期
Chart.AxisX.GridMajorVisible = False \'隐藏X轴的网格线
chart.AxisX.ClearValueLabel
Chart.SeriesList.Clear
Dim i As Integer = 0
Dim bchart = chart.BaseControl
With Chart.SeriesList
For Each dr As DataRow In t2.DataTable.Select("项目 = \'" & t1.current("项目") & "\'")
.AddGanttSeries(dr("进度节点"), dr("开始时间"), dr("结束时间"))
.AddGanttLabels("M月d日")
Chart.SeriesList(i).LineColor= Color.Red
i += 1
Next
End With
Dim cls = bchart.ChartLabels.LabelsCollection
For i = 0 To cls.count-1
cls(i).style.forecolor = Color.black
Next
End If
-- 发布时间:2018/7/27 9:17:00
--
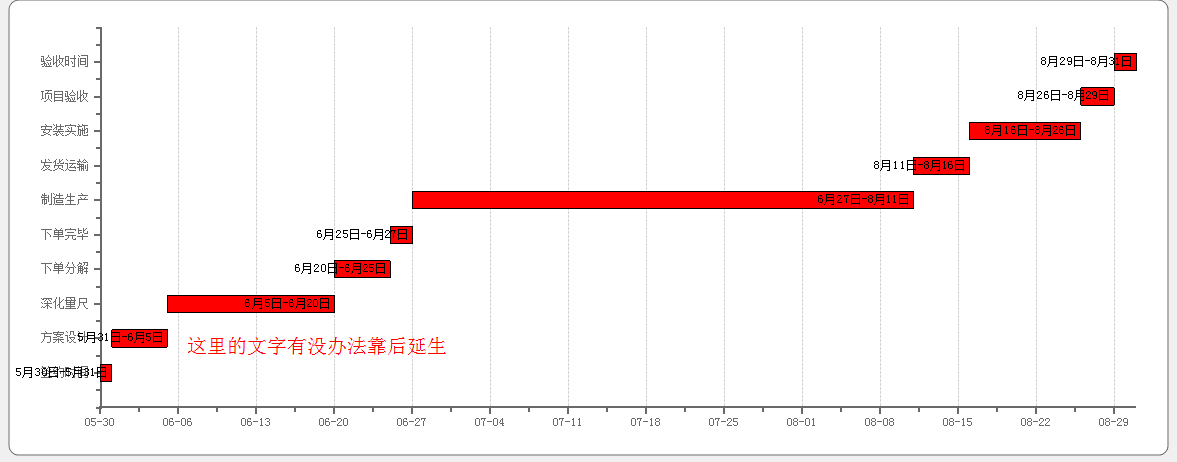
如果文字超出范围 希望往后靠 或
 此主题相关图片如下:企业微信截图_20180727091607.png
往前靠
-- 发布时间:2018/7/27 9:37:00
--
Dim cr = e.Table.current
If cr IsNot Nothing AndAlso Forms("窗口1").opened Then
Dim Chart As WinForm.Chart
Chart= Forms("窗口1").Controls("Chart1")
Chart.ChartType = ChartTypeEnum.Gantt
Chart.Inverted = True \'对调X轴和Y轴位置
Chart.AxisY.DateType= True \'Y轴为日期型
Chart.AxisY.AnnoFormatString = "MM-dd" \'设置Y轴的标示格式
Dim t1 As Table = Tables("项目")
Dim t2 As Table = Tables("项目进度")
Dim min = t2.Compute("min(开始时间)", "项目 = \'" & t1.current("项目") & "\'")
Dim max = t2.Compute("max(结束时间)", "项目 = \'" & t1.current("项目") & "\'")
Chart.AxisY.MinDate = min
Chart.AxisY.MaxDate = max \'设置Y轴的终止日期
Chart.AxisX.GridMajorVisible = False \'隐藏X轴的网格线
chart.AxisX.ClearValueLabel
Chart.SeriesList.Clear
Dim i As Integer = 0
Dim bchart = chart.BaseControl
With Chart.SeriesList
For Each dr As DataRow In t2.DataTable.Select("项目 = \'" & t1.current("项目") & "\'")
.AddGanttSeries(dr("进度节点"), dr("开始时间"), dr("结束时间"))
.AddGanttLabels("M月d日")
Chart.SeriesList(i).LineColor= Color.Red
\'Chart.SeriesList(i).DataLabelCompass=LabelCompassEnum.East
i += 1
Next
End With
Dim cls = bchart.ChartLabels.LabelsCollection
For i = 0 To cls.count-1
cls(i).style.forecolor = Color.black
\' cls(i).Compass = 10 \'上下
cls(i).Offset = -2 \'左右
Next
End If