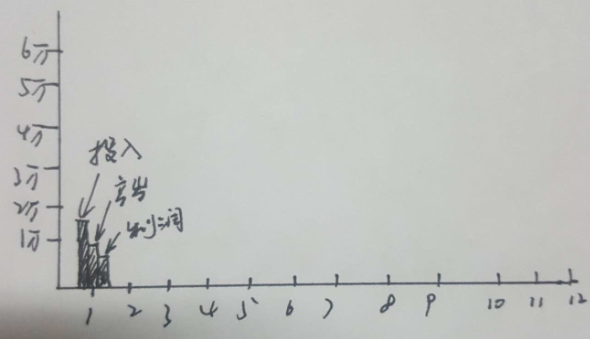
【图表】怎么生成如图格式的多柱形图呢?
假定表A有 门店名称 投入 产出 利润 年份 月份 六个字段
1店 1000 1200 200 2012 07
1店 1000 1200 200 2012 08
2店 2000 4000 2000 2012 07
2店 2000 4000 2000 2012 08
3店 3000 7000 4000 2012 07
3店 3000 7000 4000 2012 08
怎么生成如下图呢?
 此主题相关图片如下:微信图片_20171204211657.png

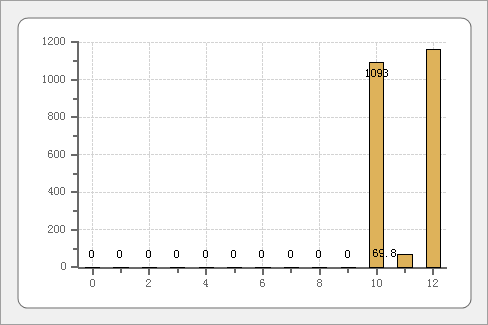
下面的代码只能实现单柱形图
Dim Chart As WinForm.Chart '定义一个图表变量
Dim Series As WinForm.ChartSeries '定义一个图系变量
Dim t As Table = Tables("门店产值") '定义一个变量t引用数据表
Chart = e.Form.Controls("Chart2") ' 引用窗口中的图表
Chart.ChartType = ChartTypeEnum.bar
'图表类型改为Bar(条形)
Chart.SeriesList.Clear() '清除图表原来的图系
t.filter = "门店名称 = '永吉地板'"
For r As Integer = 0 To t.Rows.Count - 1
Series = Chart.SeriesList.Add() '增加一个图系
Series.Text = t.rows(r)("门店名称") '设置图系的标题
Series.Length = t.cols.Count - 2 '设置图系的长度
For i As Integer = 2 To t.cols.count-1
Series.X(i-2) = i-2
Series.Y(i-2) = t.Rows(r)(t.cols(i).name)
Chart.AxisX.SetValueLabel(i-2, t.cols(i).name) '指定字符表示
Next
Next
Series.DataLabelText = "{#YVAL}"
Series.TooltipText = "永吉地板{#XVAL}月, {#YVAL}元"
'Chart.AxisX.AnnoWithLabels = True '启用字符标示
''Chart.VisualEffect = True '加上这一行,让你的图表更漂亮
'Chart.LegendVisible = True '显示图列
'Chart.LegendCompass= CompassEnum.South '图列显示在南方(底端)
 此主题相关图片如下:1.png


 加好友
加好友  发短信
发短信

 Post By:2017/12/4 21:25:00 [显示全部帖子]


 加好友
加好友  发短信
发短信

 Post By:2017/12/4 22:15:00 [显示全部帖子]
