- Foxtable(狐表) (http://foxtable.com/bbs/index.asp)
-- 专家坐堂 (http://foxtable.com/bbs/list.asp?boardid=2)
---- [求助]手机版生成的图表 (http://foxtable.com/bbs/dispbbs.asp?boardid=2&id=139871)
-- 发布时间:2019/8/23 17:24:00
-- [求助]手机版生成的图表
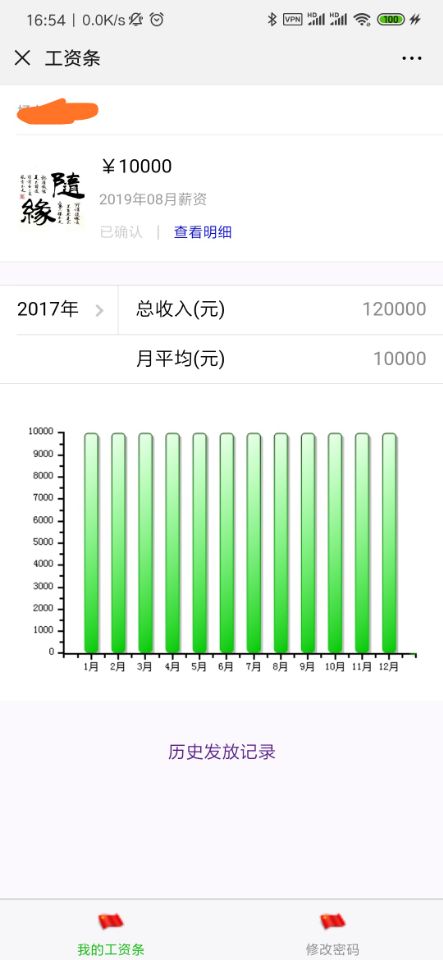
 此主题相关图片如下:tim图片20190823171950.jpg
正常情况一月和十二月只能显示一半,没有办法整成了14个月,0和13隐藏 ,有没有好的解决办法?
怎么设置x轴的刻度,现在两个月份中间还有一个刻度
-- 发布时间:2019/8/23 17:27:00
--
请使用代码说明
-- 发布时间:2019/8/23 17:50:00
--
Dim Chart As New ChartBuilder
Dim Series As WinForm.ChartSeries
Chart.ChartType = ChartTypeEnum.Bar
Chart.PrintWidth = 140
Chart.PrintHeight = 100
Chart.VisualEffect = True
Series = Chart.SeriesList.Add()
Series.Length = 14
Chart.AxisX.Min = 0
Chart.AxisX.Max = 13
Chart.AxisX.Minor = 1
Series.X(0) = 0
Series.Y(0) = 0
Chart.AxisX.SetValueLabel(0,"")
For i As Integer = 1 To 12
Series.X(i) = i
Dim y As String = CStr(i)
Dim ny As String = nf & y.PadLeft(2,"0")
Dim drgz As DataRow = dtg.SQLFind(FT & "And 年月 = \'" & ny & "\'")
If drgz IsNot Nothing Then
Series.Y(i) = drgz("实发工资")
Else
Series.Y(i) = 0
End If
Chart.AxisX.SetValueLabel(i,i & "月")
Next
Series.X(13) = 13
Series.Y(13) = 0
Chart.AxisX.SetValueLabel(13,"")
Series.FillColor= Color.Green
Chart.AxisX.AnnoWithLabels = True
wb.InsertHTML("form1","<div id=\'p1\'><img width=\'100%\' src=\'" & wb.ImageToBase64(Chart.Image) & "\'/></div>")
-- 发布时间:2019/8/23 20:10:00
--
Dim Chart As New ChartBuilder
Dim Series As WinForm.ChartSeries
Chart.ChartType = ChartTypeEnum.Bar
Chart.PrintWidth = 140
Chart.PrintHeight = 100
Chart.VisualEffect = True
Series = Chart.SeriesList.Add()
Series.Length = 12
For i As Integer = 0 To 11
Series.X(i) = i
Dim y As String = CStr(i)
Dim ny As String = nf & y.PadLeft(2,"0")
Dim drgz As DataRow = dtg.SQLFind(FT & "And 年月 = \'" & ny & "\'")
If drgz IsNot Nothing Then
Series.Y(i) = drgz("实发工资")
Else
Series.Y(i) = 0
End If
Chart.AxisX.SetValueLabel(i,(i+1) & "月")
Next
Series.FillColor= Color.Green
Chart.AxisX.AnnoWithLabels = True
[此贴子已经被作者于2019/8/23 20:10:32编辑过]
-- 发布时间:2019/8/24 9:58:00
--
代码如下:
With wb.AddInputGroup("form1","ipg1","")
With .AddInputCell("ic1") \'通过InputCell增加输入框
.AddLabel("ln0l"," " & " " & " " & " ",0) \'增加标签,0显示在左边
.AddSelect("yfs",yfx,1).Attribute = ""
.AddLabel("ln03"," " & " " & " " & " ",2) \'增加标签,2显示在右边
End With
wb.InsertHTML("form1","<center><p style=""font-family:arial;color:green;font-size:60px;"">" & drg("实发工资") & "</p></center>")
wb.InsertHTML("form1","<center>亲爱的" & un & ",感谢您的辛勤付出!</center>")
End With
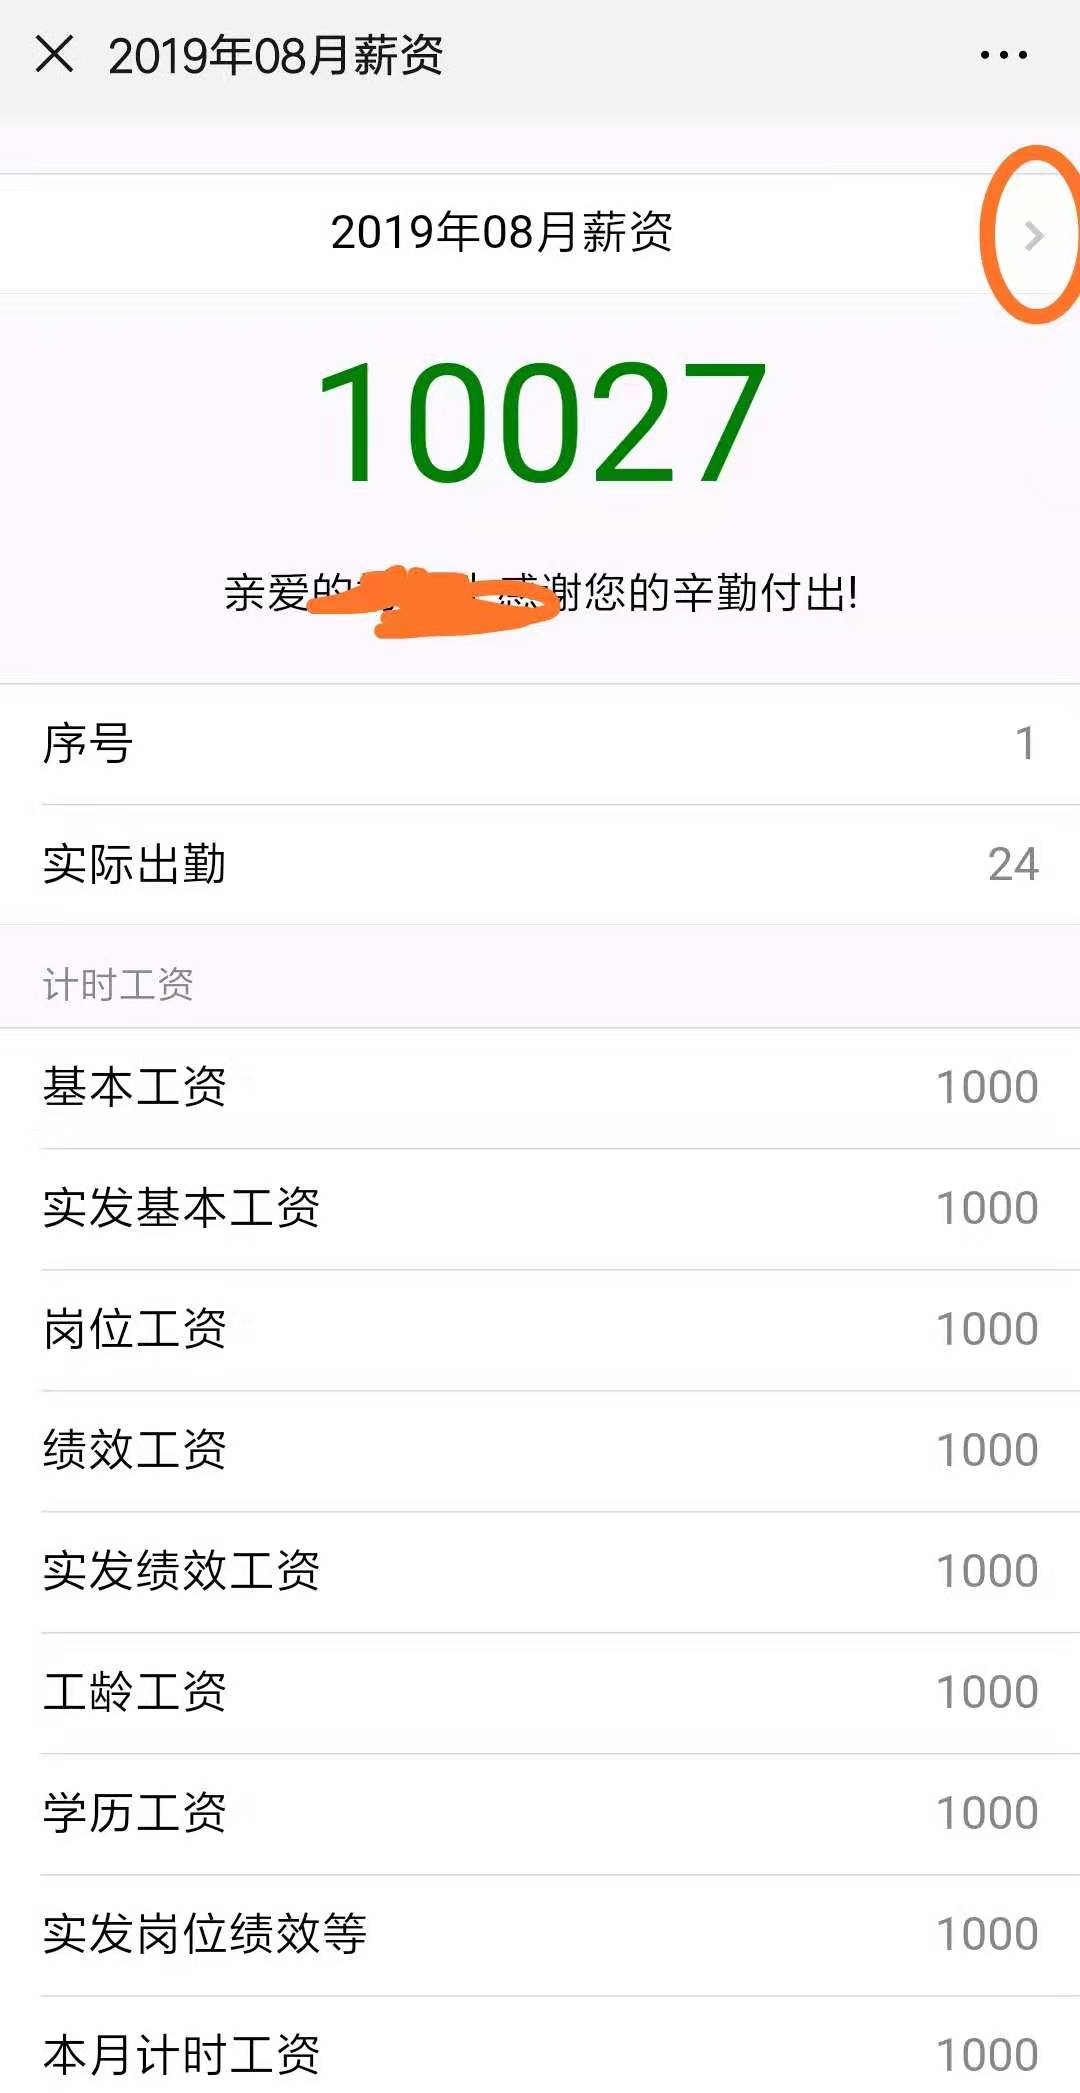
图示的箭头不是应该在中间吗?为什么会跑到最后面了?需要怎么才会在中间?
-- 发布时间:2019/8/24 10:02:00
--
在哪里添加的箭头?
-- 发布时间:2019/8/24 10:48:00
--
.AddSelect 命令自动添加的的箭头 但是为什么跑后面去了?
-- 发布时间:2019/8/24 10:49:00
--
With wb.AddInputGroup("form1","ipg1","")
With .AddInputCell("ic1") \'通过InputCell增加输入框
.AddLabel("ln0l"," " & " " & " " & " ",0) \'增加标签,0显示在左边
.AddSelect("yfs",yfx,1).Attribute = ""
.AddLabel("ln03"," " & " " & " " & " ",2) \'增加标签,2显示在右边
End With
wb.InsertHTML("form1","<center><p style=""font-family:arial;color:green;font-size:60px;"">" & drg("实发工资") & "</p></center>")
wb.InsertHTML("form1","<center>亲爱的" & un & ",感谢您的辛勤付出!</center>")
End With
-- 发布时间:2019/8/24 11:00:00
--
如果要加空格,试试这样
.AddLabel("ln0l"," ",0) \'增加标签,0显示在左边
-- 发布时间:2019/8/24 11:07:00
--
With wb.AddInputGroup("form1","ipg1","")
With .AddInputCell("ic1") \'通过InputCell增加输入框
.AddLabel("ln0l"," ",0) \'增加标签,0显示在左边
.AddSelect("yfs",yfx,1).Attribute = ""
.AddLabel("ln03"," ",2) \'增加标签,2显示在右边
End With
wb.InsertHTML("form1","<center><p style=""font-family:arial;color:green;font-size:60px;"">" & drg("实发工资") & "</p></center>")
wb.InsertHTML("form1","<center>亲爱的" & un & ",感谢您的辛勤付出!</center>")
End With
还是不行,箭头还是显示在右边
