- Foxtable(狐表) (http://foxtable.com/bbs/index.asp)
-- 专家坐堂 (http://foxtable.com/bbs/list.asp?boardid=2)
---- 窗口中的条形图根据选定的项目名称变化而改变 (http://foxtable.com/bbs/dispbbs.asp?boardid=2&id=123245)
-- 发布时间:2018/8/10 15:40:00
-- 窗口中的条形图根据选定的项目名称变化而改变
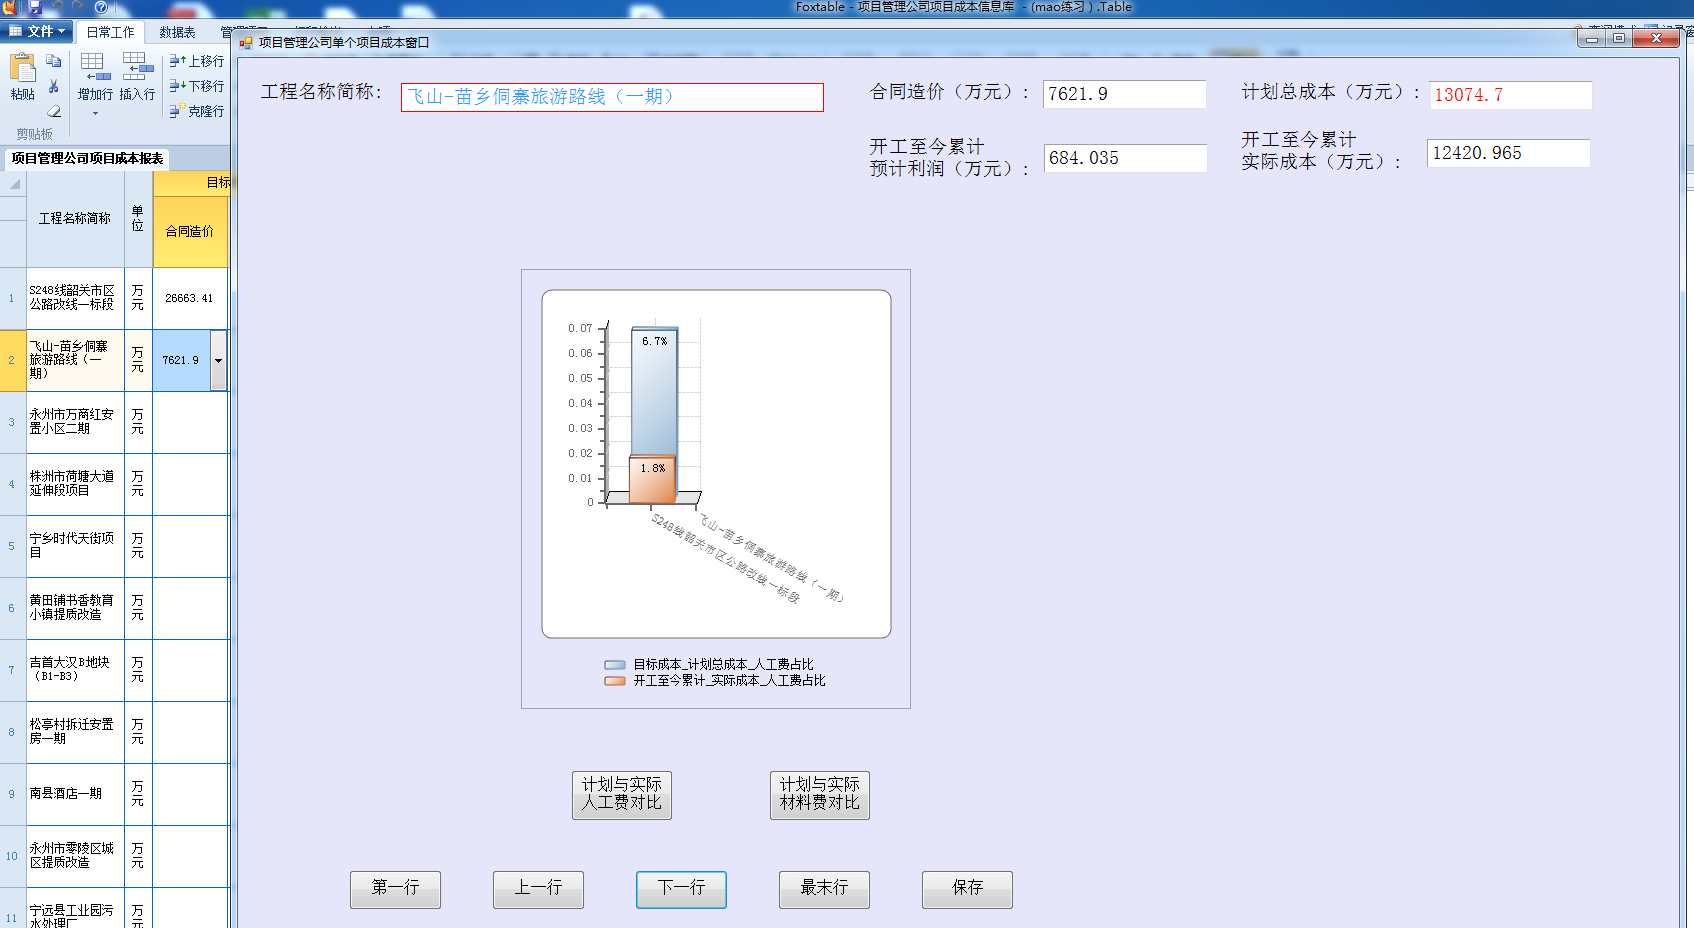
窗口中的条形图无法根据选定的项目名称变化而改变.当表中每行项目或产品改变时,对应窗口中条形图相应改变。请指导,谢谢!(我选定第二行,窗口中条形图还是显示第一行数据)

| 下载信息 [文件大小: 下载次数: ] | |
 点击浏览该文件:项目管理公司项目成本信息库 - (mao练习).table 点击浏览该文件:项目管理公司项目成本信息库 - (mao练习).table |
 此主题相关图片如下:随表格中选定行改变窗口图形.png
-- 发布时间:2018/8/10 15:56:00
--
Dim Chart As WinForm.Chart \'定义一个图表变量
Dim Series As WinForm.ChartSeries \'定义一个图系变量
Chart = e.Form.Controls("Chart1") \' 引用窗口中的图表
Chart.VisualEffect = True \'加上这一行,让你的图表更漂亮
Chart.ChartType = ChartTypeEnum.Bar \'图表类型该为Bar(条形)
Chart.SeriesList.Clear() \'清除图表原来的图系
Chart.AxisX.ClearValueLabel
Dim t As Table = Tables("项目管理公司项目成本报表") \'定义一个变量t引用数据表
Series = Chart.SeriesList.Add() \'增加一个图系
Series.Text = "目标成本_计划总成本_人工费占比"
Series.Length = 1 \'设置图系的长度
Dim r = t.Current.Index
Series.X(0) = 0
If t.Rows(r)("目标成本_计划总成本_人工费占比") <> Nothing Then
Series.Y(0) = t.Rows(r)("目标成本_计划总成本_人工费占比")
End If
Chart.AxisX.SetValueLabel(0, t.Rows(r)("工程名称简称")) \'指定字符表示
Series.DataLabelText = "{#YVAL:0.0%}"
Series.Length =1
Series = Chart.SeriesList.Add() \'增加一个图系
Series.Text = "开工至今累计_实际成本_人工费占比"
Series.Length = 1 \'设置图系的长度
Series.X(0) = 0
If t.Rows(r)("开工至今累计_实际成本_人工费占比") <> Nothing
Series.Y(0) = t.Rows(r)("开工至今累计_实际成本_人工费占比")
End If
Series.DataLabelText = "{#YVAL:0.0%}"
Series.Length =1
Chart.AxisX.AnnoRotation = 30\'X轴标示逆时针旋转45度
Chart.LegendVisible = True \'显示图列
Chart.LegendCompass= CompassEnum.South \'图列显示在南方(底端)
Chart.AxisX.AnnoWithLabels = True \'启用字符标示
Dim a As C1Chart.C1Chart = e.Form.Controls("Chart1").BaseControl
Dim b As C1Chart.ChartGroup = a.ChartGroups.Group0
\'b.Use3D = True
a.ChartArea.Inverted = False
a.ChartArea.PlotArea.View3D.Depth = 40
a.ChartArea.PlotArea.View3D.Elevation = 20
a.ChartArea.PlotArea.View3D.Rotation = 8
a.ChartArea.PlotArea.View3D.Shading = 2
b.Bar.Appearance = 0
b.Bar.MultiRow = True
b.Use3D = True
b.Stacked = False
-- 发布时间:2018/8/10 15:57:00
--
请指导。密码888
-- 发布时间:2018/8/10 16:07:00
--
非常感谢!